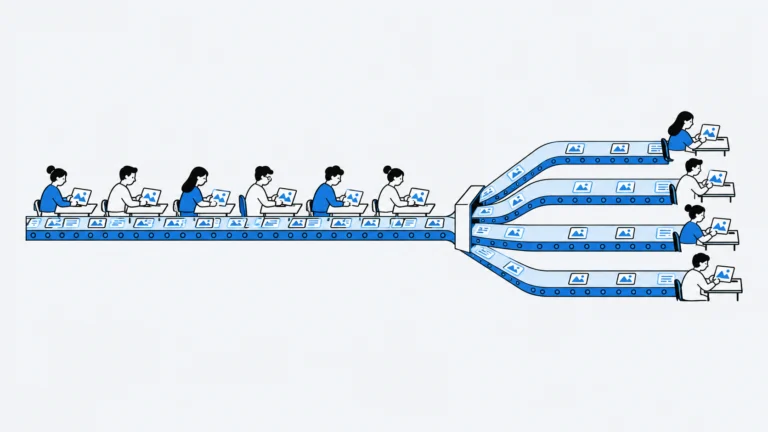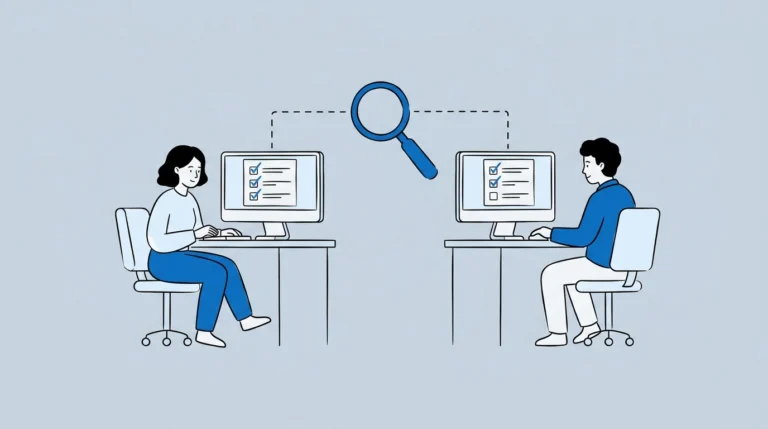
Two annotators who agree 90% of the time sound reliable. But if 85% of your data belongs to one class, they could reach that number almost by guessing. That is the problem inter-annotator agreement (IAA) metrics are built to solve.
Why Raw Percent Agreement Misleads
Percent agreement counts how often two people chose the same label. It ignores how often they would match by chance. On imbalanced datasets, which is most real-world data, chance agreement is high, so percent agreement flatters weak guidelines.
The Metrics Worth Knowing
- Cohen’s kappa. Compares observed agreement between two annotators with the agreement expected by chance: κ = (p₀ − pₑ) / (1 − pₑ). A score of 1 is perfect agreement; 0 means no better than chance.
- Fleiss’ kappa. Extends the same idea to three or more annotators rating the same items.
- Krippendorff’s alpha. Handles missing ratings, any number of annotators and ordinal or interval scales, which makes it the most flexible choice for production pipelines.
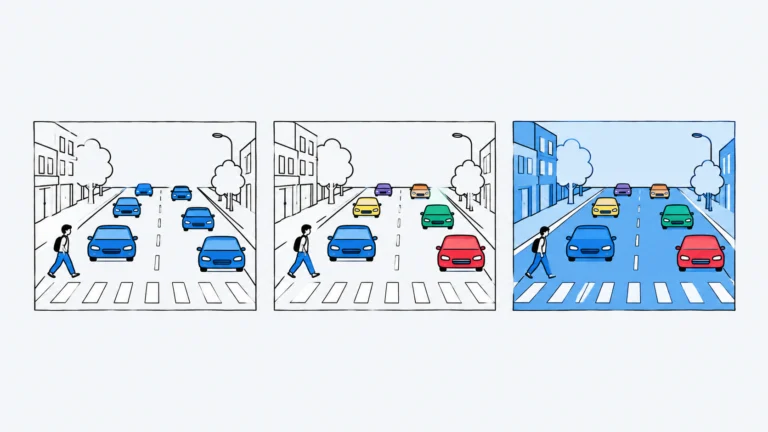
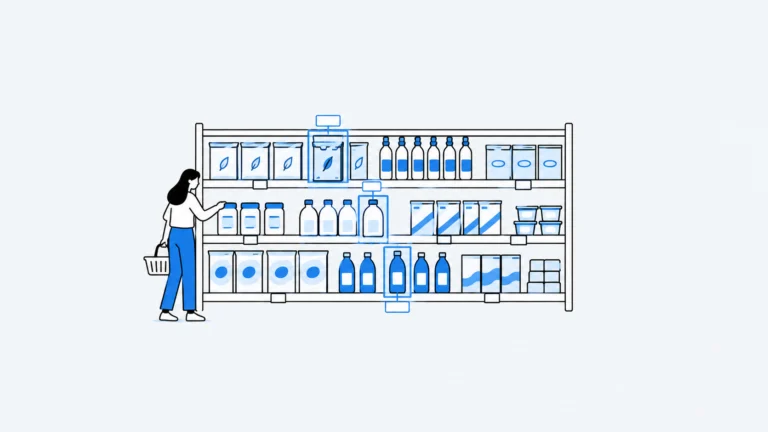
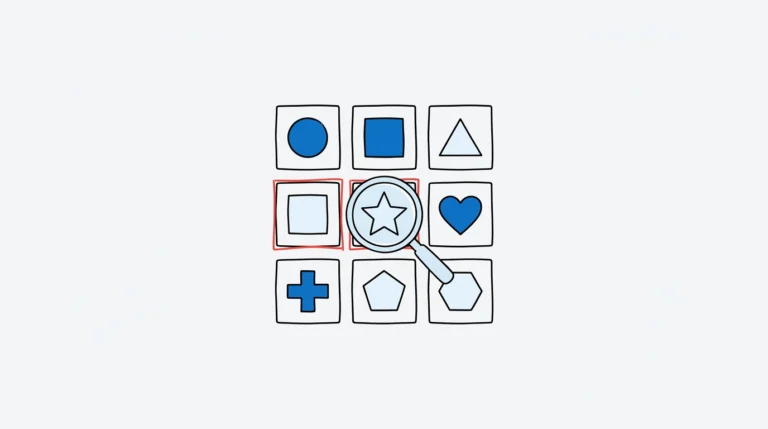
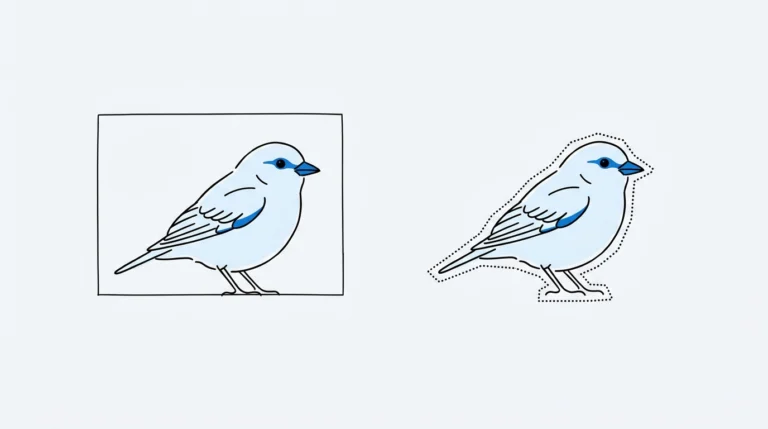
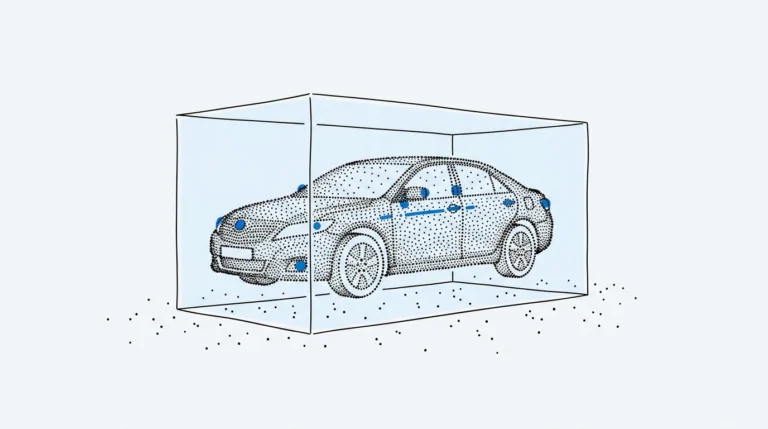
- IoU and F1 for spatial labels. For boxes, polygons and masks, agreement is usually measured as overlap between two annotators’ shapes rather than as matching categories.
Reading the Numbers Carefully
Kappa values drop sharply when one class dominates, even when annotators genuinely agree. This is known as the kappa paradox. Always read agreement alongside the class distribution, and compare per-class scores rather than one global number.
High agreement proves consistency, not correctness. Two annotators can agree perfectly and both be wrong.
Turning Agreement Into Better Data
- Run a calibration batch where every annotator labels the same 100–200 items before production starts
- Review the lowest-agreement classes first; they usually point to an unclear rule, not a careless annotator
- Update the guideline with the resolved examples and re-measure
- Keep a small overlap set in every batch so agreement is tracked over time, not just at kickoff
How We Use It
At Smart Annotahub, agreement checks run on overlap samples in every project. When a class falls below target, the QA lead reviews disagreements with the annotators and the guideline is updated before the next batch ships.
About Smart Annotahub
Smart Annotahub is a managed data annotation company based in Ha Noi, Viet Nam. Our in-house annotators, QA leads and project managers turn raw image, video, 3D, geospatial, text and audio data into training-ready datasets for teams building computer vision, robotics and language AI. Every project starts with a free pilot, runs on your guidelines and tools, and ships with multi-stage quality checks.
Our Services
Frequently Asked Questions
How does the free pilot work?
Send us a sample of your data and your guidelines. We annotate it at no cost, report accuracy and turnaround, and return a precise quote, usually within a few working days.
How do you ensure annotation quality?
Every batch passes annotator self-checks, peer review and a dedicated QA lead. We agree accuracy targets up front and share QA reports with each delivery.
Can you work in our annotation tool?
Yes. Our team works in your platform or ours and delivers in the formats your pipeline expects, such as COCO, YOLO, Pascal VOC or custom JSON.
How is my data kept secure?
All work is done by our in-house team under NDA, with role-based access and no data leaving approved environments. See our Data Privacy Notice for details.
How is pricing calculated?
Per object, per hour or per project, depending on the task. See Pricing for reference rates, or request a pilot for an exact quote.
Want to see the difference on your own data?
Request Free Pilot